How to Read Your dochost Page Analytics
Views and likes for every page, per-page daily charts, and an account-wide curve on Max. Here is where each number lives, how views are counted without any tracking script, and why the totals sometimes differ from Google Analytics.
Every dochost page counts its own readers, and paid accounts get that data in two places: a per-page manage screen and an account-wide Analytics page. This guide shows both, explains what a "view" is, and lists what each plan unlocks.
Per page: the manage screen
From the dashboard, click any page. The top of the manage screen shows the link, three totals — Views, Likes, Avg. daily — and a Views, last 14 days chart.
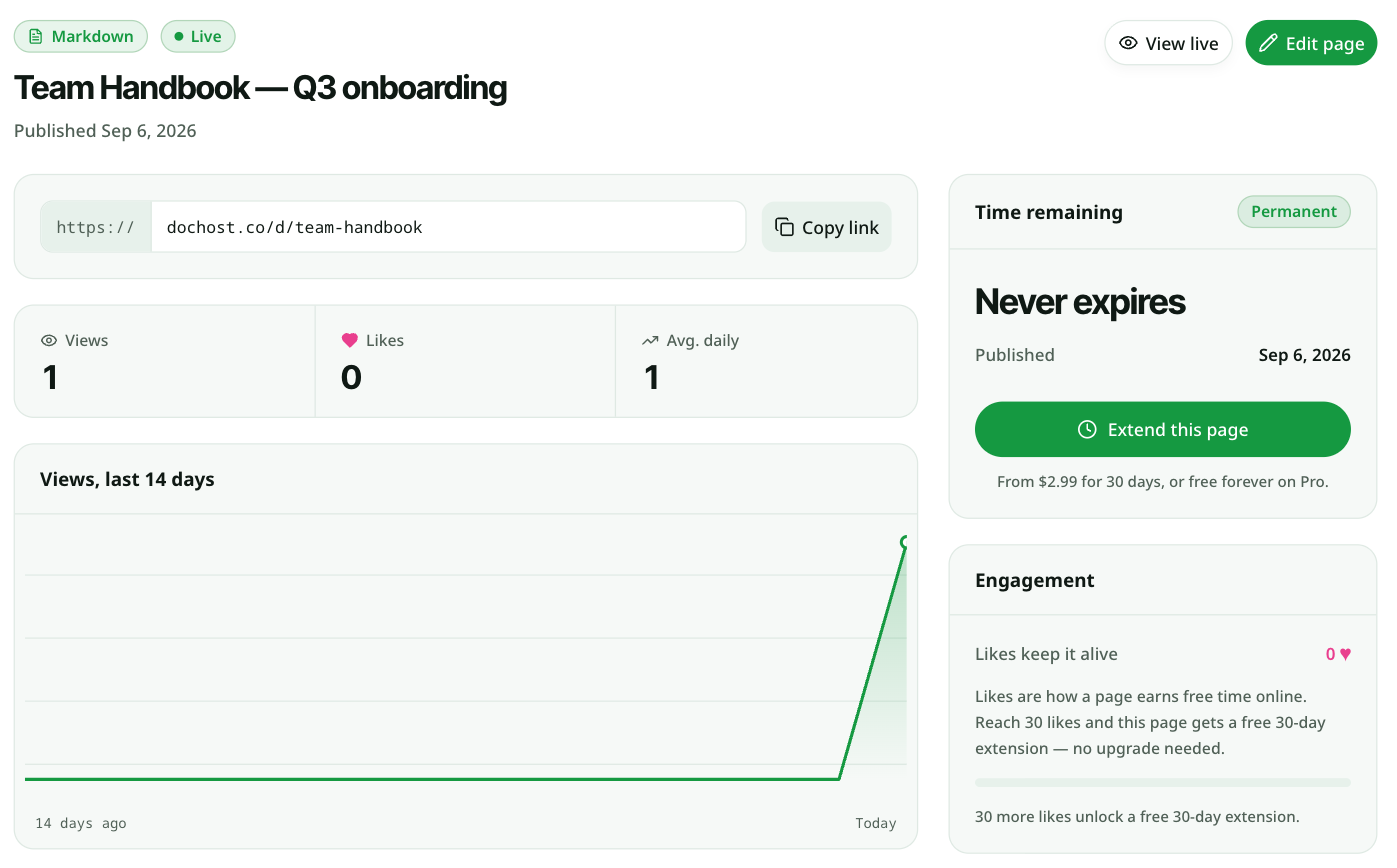
The Engagement card on the right tracks likes towards the next free extension, and Time remaining shows the page's expiry — see How Long a Free dochost Link Lasts.
Account-wide: the Analytics page
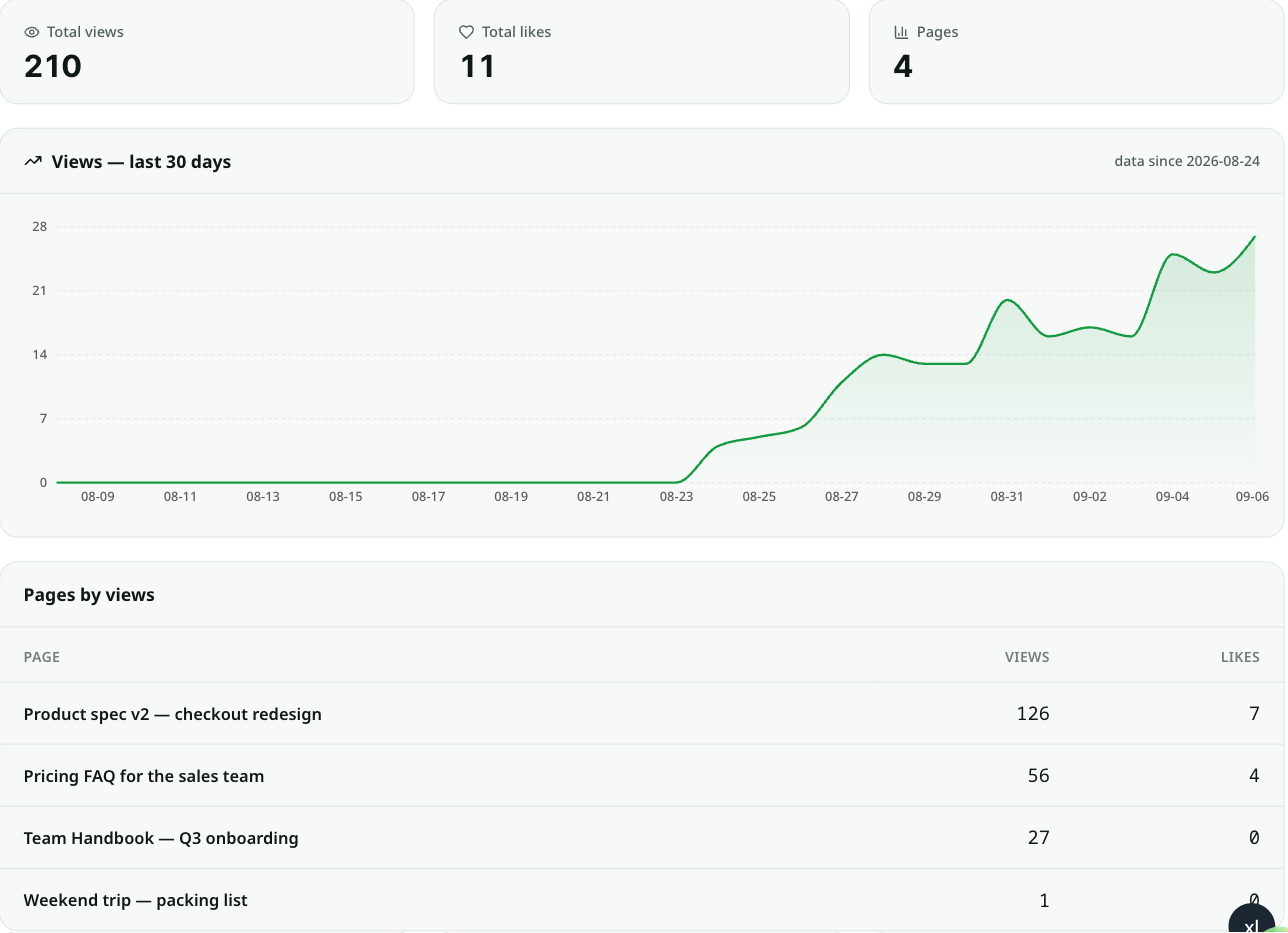
Analytics in the sidebar rolls everything up:
- Total views, Total likes and Pages across the account.
- Views — last 30 days: one curve for all your pages combined, with the date the data starts.
- Pages by views: a table of every page, most viewed first, with likes alongside. Click a row to open that page's manage screen.
What counts as a view
A view is counted on the server when a reader's browser loads the page and fetches a one-pixel image from the page's own host. That design has three consequences worth knowing:
- No script is injected into your page. HTML you publish runs exactly as written; dochost does not add a tracker to it. The pixel is part of the page shell around your document.
- Ad blockers do not remove it. Because it is a plain image on the same host, the count survives the blockers that hide Plausible or Google Analytics — so dochost numbers are usually higher than what a third-party tool would report for the same page.
- Password-protected pages count only unlocked reads. A visitor who bounces off the password gate is not a view.
Views are aggregated per page per day. The 14-day and 30-day charts are built from those daily buckets, which is also why a page's total can be larger than the sum of the chart: the total includes days before the chart's window.
Likes are separate: a reader clicks the heart in the corner pill of a public page, once per browser.
What each plan shows
| Free | Pro | Max | |
|---|---|---|---|
| View and like totals per page | — | ✓ | ✓ |
| 14-day chart on the manage screen | — | ✓ | ✓ |
| Account totals and Pages by views | — | ✓ | ✓ |
| 30-day account-wide curve | — | — | ✓ |
On the free plan the Analytics page explains what is locked; the per-page counts still accrue in the background, so upgrading later shows history, not a blank slate. Plans are on pricing.
Reading the numbers
- A spike on day one is normal. Most pages get the majority of their reads in the first 24 hours after being shared. A flat line afterwards is not a problem with counting.
- Avg. daily divides total views by the days since publishing, so a page that had a burst and then went quiet will show a falling average.
- Every load counts. There is no cookie and no fingerprinting, so a reader who opens the page three times is three views. Obvious crawlers and link-preview fetchers are filtered by user agent and never counted.
- Pages published from Claude, ChatGPT or the extension appear here too. Analytics is per account, not per channel.
更多文章
Free HTML to URL: 7 Tools That Turn an HTML File Into a Shareable Link
Seven free ways to turn an HTML file or Markdown document into a shareable URL, compared on accounts, JavaScript support and how long the link lasts.

Turn Any AI Output Into a Shareable Link
Every AI tool leaves you with output trapped in a chat window. Here's the neutral step that turns it into one clean link for your team or client.
Are Claude Artifacts Public? What the Link Actually Exposes
An artifact is private until you publish it — and a published one is unlisted, not secret. Here's exactly who can see what, and how to share something that stays genuinely restricted.
邮件列表
加入我们的社区
订阅邮件列表,及时获取最新消息和更新